
A hot-off-the-press study on risk of death and running is making headlines. What are the headlines? “Light Jogging May Be The Key To Long Life, Study Finds” (In-Depth–Huffington Post–Feb 3, 2015), or “When it comes to jogging, less is more, study argues” (Los Angeles Times–Feb 2, 2015). A study of 1500 people from Copenhagen, Denmark, is being touted as suggesting that while jogging is better than not jogging, jogging strenuously is as bad as not exercising at all. The truth? Such talk about the study results is a total misreading of statistics and based on a complete misunderstanding of confidence intervals and small data sets.
A study entitled “Dose of Jogging and Long-Term Mortality;
The Copenhagen City Heart Study” by authors Peter Schnohr, MD, DMSC, James H. O’Keefe, MD, Jacob L. Marott, MSC, Peter Lange, MD, DMSC, and Gorm B. Jensen, MD, DMSC has been published in the Journal of the American College of Cardiology [1]. It’s made some waves. Headlines like those listed in the opening paragraph of this post capture the general sense: a new study finds that jogging too much is as bad as sitting around and not jogging at all. But does it?
Here is the key table that the authors emphasize in their paper:
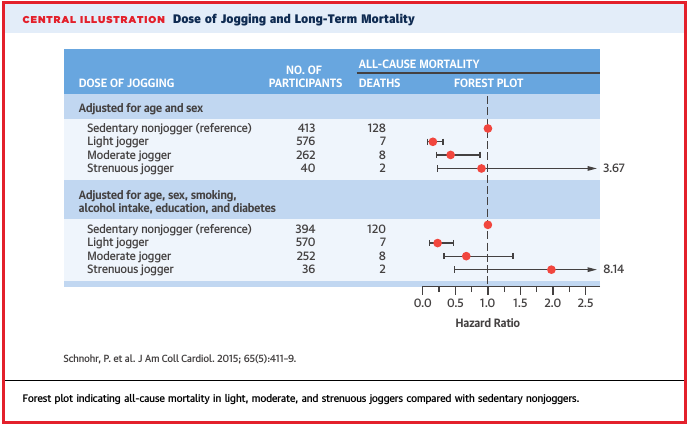
From Ref. 1.
The key data to look at are the last four rows, which correct for other factors that can influence mortality in each group. Independent of HOW the authors define “strenuous jogging” vs. “light jogging,” we can already pick out what appear, to the flawed human perception of risk, to be trends. The “Hazard Ratio” central value (red dot) is 1 for sedentary people (by construction), drops to about 0.32 for light joggers, and above that appears to creep back to a value of 1.
But does it? What are those black bars? Those are 95% Confidence Intervals. They are supposed to represent the range of numbers that, at 95% confidence level, include the “true value” – the actual value in nature of the Hazard Ratio for each class. The data analysis is trying to figure out that true value, but of course it’s not known. A naive reading of the red dots suggests that the HR values trend back to 1 for more strenuous jogging. But the intervals all overlap. At best, it’s very hard to draw ANY reliable conclusions from this way of representing the data.
The problem is one of “small statistics.” If you dig deeper into the details of the publication, you find that each group was drawn from people in the Copenhagen Population Register from 2001 – 2003. People targeted in the study were assessed using questionnaires to determine their habits – already, this is not the best way to get data about diet, exercise, and other habits, as it relies on personal testimony. Nonetheless, the authors note that other studies suggest there is enough reliability in this methodology to use the data. The authors determine if a person in the sample has died by cross-referencing their register ID with hospital records. It’s important to note that questionnaire data were ONLY gathered from 2001-2003, according to the authors. While there was follow-up mentioned by the authors, it is unclear whether follow-up included assessing their jogging habits after 2003. This suggests we actually have NO IDEA how these people’s exercise habits changed from 2003-2013, the close of the data set.
With that in mind, the table above tells us, of the people studied:
- who were sedentary, and of those, how many of them died by the end of 2013?
- who were light joggers, and of those how many of them died by the end of 2013?
- who were moderate joggers, and of those how many of them died by the end of 2013?
- who were strenuous joggers, and of those how many of them died by the end of 2013?
We see that in this last category, there is a WOEFUL lack of statistics. Of the 36 people eligible for final inclusion in the study, 2 died. In the moderate category, of the 252 eligible people 8 of them died. In the light category, of the 570 eligible people, 7 of them died. Finally, in the sedentary category, of the 394 eligible people, 120 of them died.
Let’s ignore this hazard ratio and instead ask a much simpler question: if you were a 20-95 year old citizen of Copenhagen in 2001-2003 and self-reported as sedentary, a light jogger, a moderate jogger, or a strenuous jogger, what was your probability of dying by the time April 2013 rolled around?
To answer that, we need only apply some basic binomial statistics. In this case, there is a sample of N people. There are two outcomes for those N people: death, or not death. There are n people of N that die in each group. The probability of dying is thus p = n/N. The uncertainty on the number of dead people from statistics alone is given by sqrt(N*p*(1-p)). The error on the death probability, p, is thus (p/n)*sqrt(N*p*(1-p)).
So, what are the probabilities in each category of death?
- Sedentary: (30.5 +/- 2.3)%
- Light Jogger: (1.2 +/- 0.4)%
- Moderate Jogger: (3.2 +/- 1.1)%
- Strenuous Jogger: (5.6 +/- 3.8)%
What do you notice? First of all, media outlets have buried the lead: if you were a Danish resident of Copenhagen and were self-reported as “sedentary” between 2001-2003, you had a 30.5% chance of being dead by April, 2013.
If you were a jogger, however, your chance of being in that same group and being dead by April, 2013, was a mere 3% (or so). What about if you were a strenuous jogger, compared to a light jogger? The data are unclear. There is no convincing evidence, outside statistical fluctuations, of a trend. The difference between the death probability of being a strenuous jogger or a light jogger is (4.4 +/- 3.8)% . . . barely a 1 standard deviation difference between the two. The threshold for discovery in my field is a whopping 5 standard deviations, much for reliable for assessing the reality of a trend above background noise. This data simply contains too much noise to draw conclusions, and the authors should have recognized that.
So should the media. Shame on those institutions who pounced on a single, non-replicated study using such poor statistics to assess relative risk. Journalism majors should be required to take more math and statistics to get their degrees, to avoid falling for these rookie mistakes in judgement.
So, if you like a hard run once a week, should you stop? The data don’t say you have to. It’s not convincing yet. The bottom line, though, is really this: if you are sedentary, and you think that people in Copenhagen from 2001-2003 who self-reported as “sedentary” are enough like you, get moving . . . or you are seriously raising your risk of an unnecessarily premature death.
[1] http://dx.doi.org.proxy.libraries.smu.edu/10.1016/j.jacc.2014.11.023

