
I hear a lot of interesting things when I play the “fly-on-the-wall scientist.” Most statements uttered casually between friends can be tested scientifically; at the very least, research has already been done and one only needs to dig a little to find out whether the statement is true. There are many things in life that can be demonstrated true and false. Grab a bowl; let’s pop a serving of buttery science!
Carbon dioxide (CO2) levels lag behind changes in global temperature. Therefore, CO2 is not a greenhouse gas and/or other causes are at work in global climate change and therefore the current changes are not human-induced (“anthropogenic”).
After concluding a review and Q&A session for my introductory physics course, I had to remain late at SMU until Jodi returned from a formal dinner event. I was killing time (trying not to think about the norovirus that was playing havoc with my intestines that same day) when a conversation between two colleagues at the other end of the room caught my attention. One of my colleagues was arguing, apparently as he usually does, that anthropogenic climate change has little or no scientific basis. To support his claim, he repeated a statement I have heard before from anthropogenic climate-change deniers (ACCDs): CO2 levels are a lagging, not a leading indicator (that is, the rise in CO2 levels TRAILS the change in temperature), and therefore CO2 is either not a greenhouse gas or global climate change is induced by factors other than CO2, so humans cannot be responsible.
I decided that this was a real opportunity to me to investigate the background of this statement. So here we go!
A look at the chart
Here is a great example of a plot that gets referred to by many ACCDs (reproduced from [1]).

Above, we see a lot of data being shown at once. Concentrate on a, b, and c. Curves a and b are the levels of CO2 and CH4 (methane), both greenhouse gases (that is, these are gases that can trap heat). We see the levels rising and falling over long periods of time, but if we compare to curve b, the isotopic atmospheric temperature, we see that changes in temperature for warming lead the changes in CO2 and CH4. For a slightly marked up version of this plot which helps see where warming trends fall and how insolation changes match to those, see the appendix below.
Why can warming ever lead greenhouse gases?
Before we proceed, it’s definitely worth understanding how the researchers came to these results. They obtained and studied ice cores from Antarctica. Ice traps bubbles of atmospheric gas, effectively encasing a snap-shot of atmospheric conditions over vast periods of time. Studying the trapped gases taught the researchers about atmospheric CO2 and CH4 levels. How do they determine temperature changes? They compare the level of Deuterium present at each level of the ice core. Heavy water isotopes are always present in water; however, water vapor will tend to contain lower levels of heavy isotopes and high levels of light ones; precipitation will contain more of the heavy isotopes and lower levels of the light ones. Changes in deuterium levels therefore are a proxy for temperature, and changes relative to modern temperatures (and the Deuterium levels at present) can be used to chart temperature back in time.
Finally, what is “insolation” shown in curve e in the above plot? According to Wikipedia [2]:
Insolation is a measure of solar radiation energy received on a given surface area in a given time. It is commonly expressed as average irradiance in watts per square meter (W/m2) or kilowatt-hours per square meter per day (kW·h/(m2·day)) (or hours/day).
As the Earth’s relationship to the sun changes due to the eccentricity of the orbit, the tilt of the rotation axis, and the precession of the earth’s orbit, so does the amount of radiation received per unit area. There is a fairly clear understanding of how this change influences Earth’s climate in regular cycles, called “Milankovitch cycles.” [3] The above graph shows that insolation, specifically increases in Joules striking the Earth, can initiate warming trends.
Increases in solar radiation can initiate warming trends by causing ice-age glaciers to recede. Melting/receding glaciers reduce Earth albedo – the property of reflectivity that, rather than trapping solar radiation simply reflects it back into space. Reduced albedo means more heating. As the heating starts to increase, CO2 and CH4 are released from storage on or in the earth (in sea water, for instance, where under cooler temperatures the gases remain trapped in the water). We see then how CO2 and CH4 levels can begin to rise after warming has begun. This then creates a feedback loop; higher levels of heat-trapping gases trap more heat, and heating begins to accelerate, causing more glacier to melt. This defines the sharp warming we see in the graph above. Subsequent re-cooling of the earth can take tens of thousands of years, after only a couple of thousand years of this warming. Then the whole thing repeats again. This, according to Antarctic ice samples, has been repeating every 100,000 years or so for the last 400,000 years.
It is important to note that the lead that temperature has on CO2 levels, historically, is a small one. Current estimates range between 200-1000 years of leading. However, the warming trend lasts thousands of years – so it does not end when CO2 and CH4 enter the atmosphere in increased amounts, it continues strongly thereafter.
What’s happening now?
So we see how insolation (the change in earth’s reception of energy from the sun) can lead to warming (decreasing glaciation), which then releases greenhouse gases after the warming is initiated and begins a few thousand year runaway period of warming.
Is that what is happening in the current period? Are ACCDs right?
The answer, quite simply, is no. Here is why.
First, look at the above graph. Our current era is at the left of the graph. We see that solar insolation is at a minimum right now – that is, we are in a period where energy from the sun is at a low-point. Previously, warming trends were always initiated on the increasing side of insolation, not on the down-side or at a minimum. So already we see a distinction between the last 400,000 years and the current warming trend.
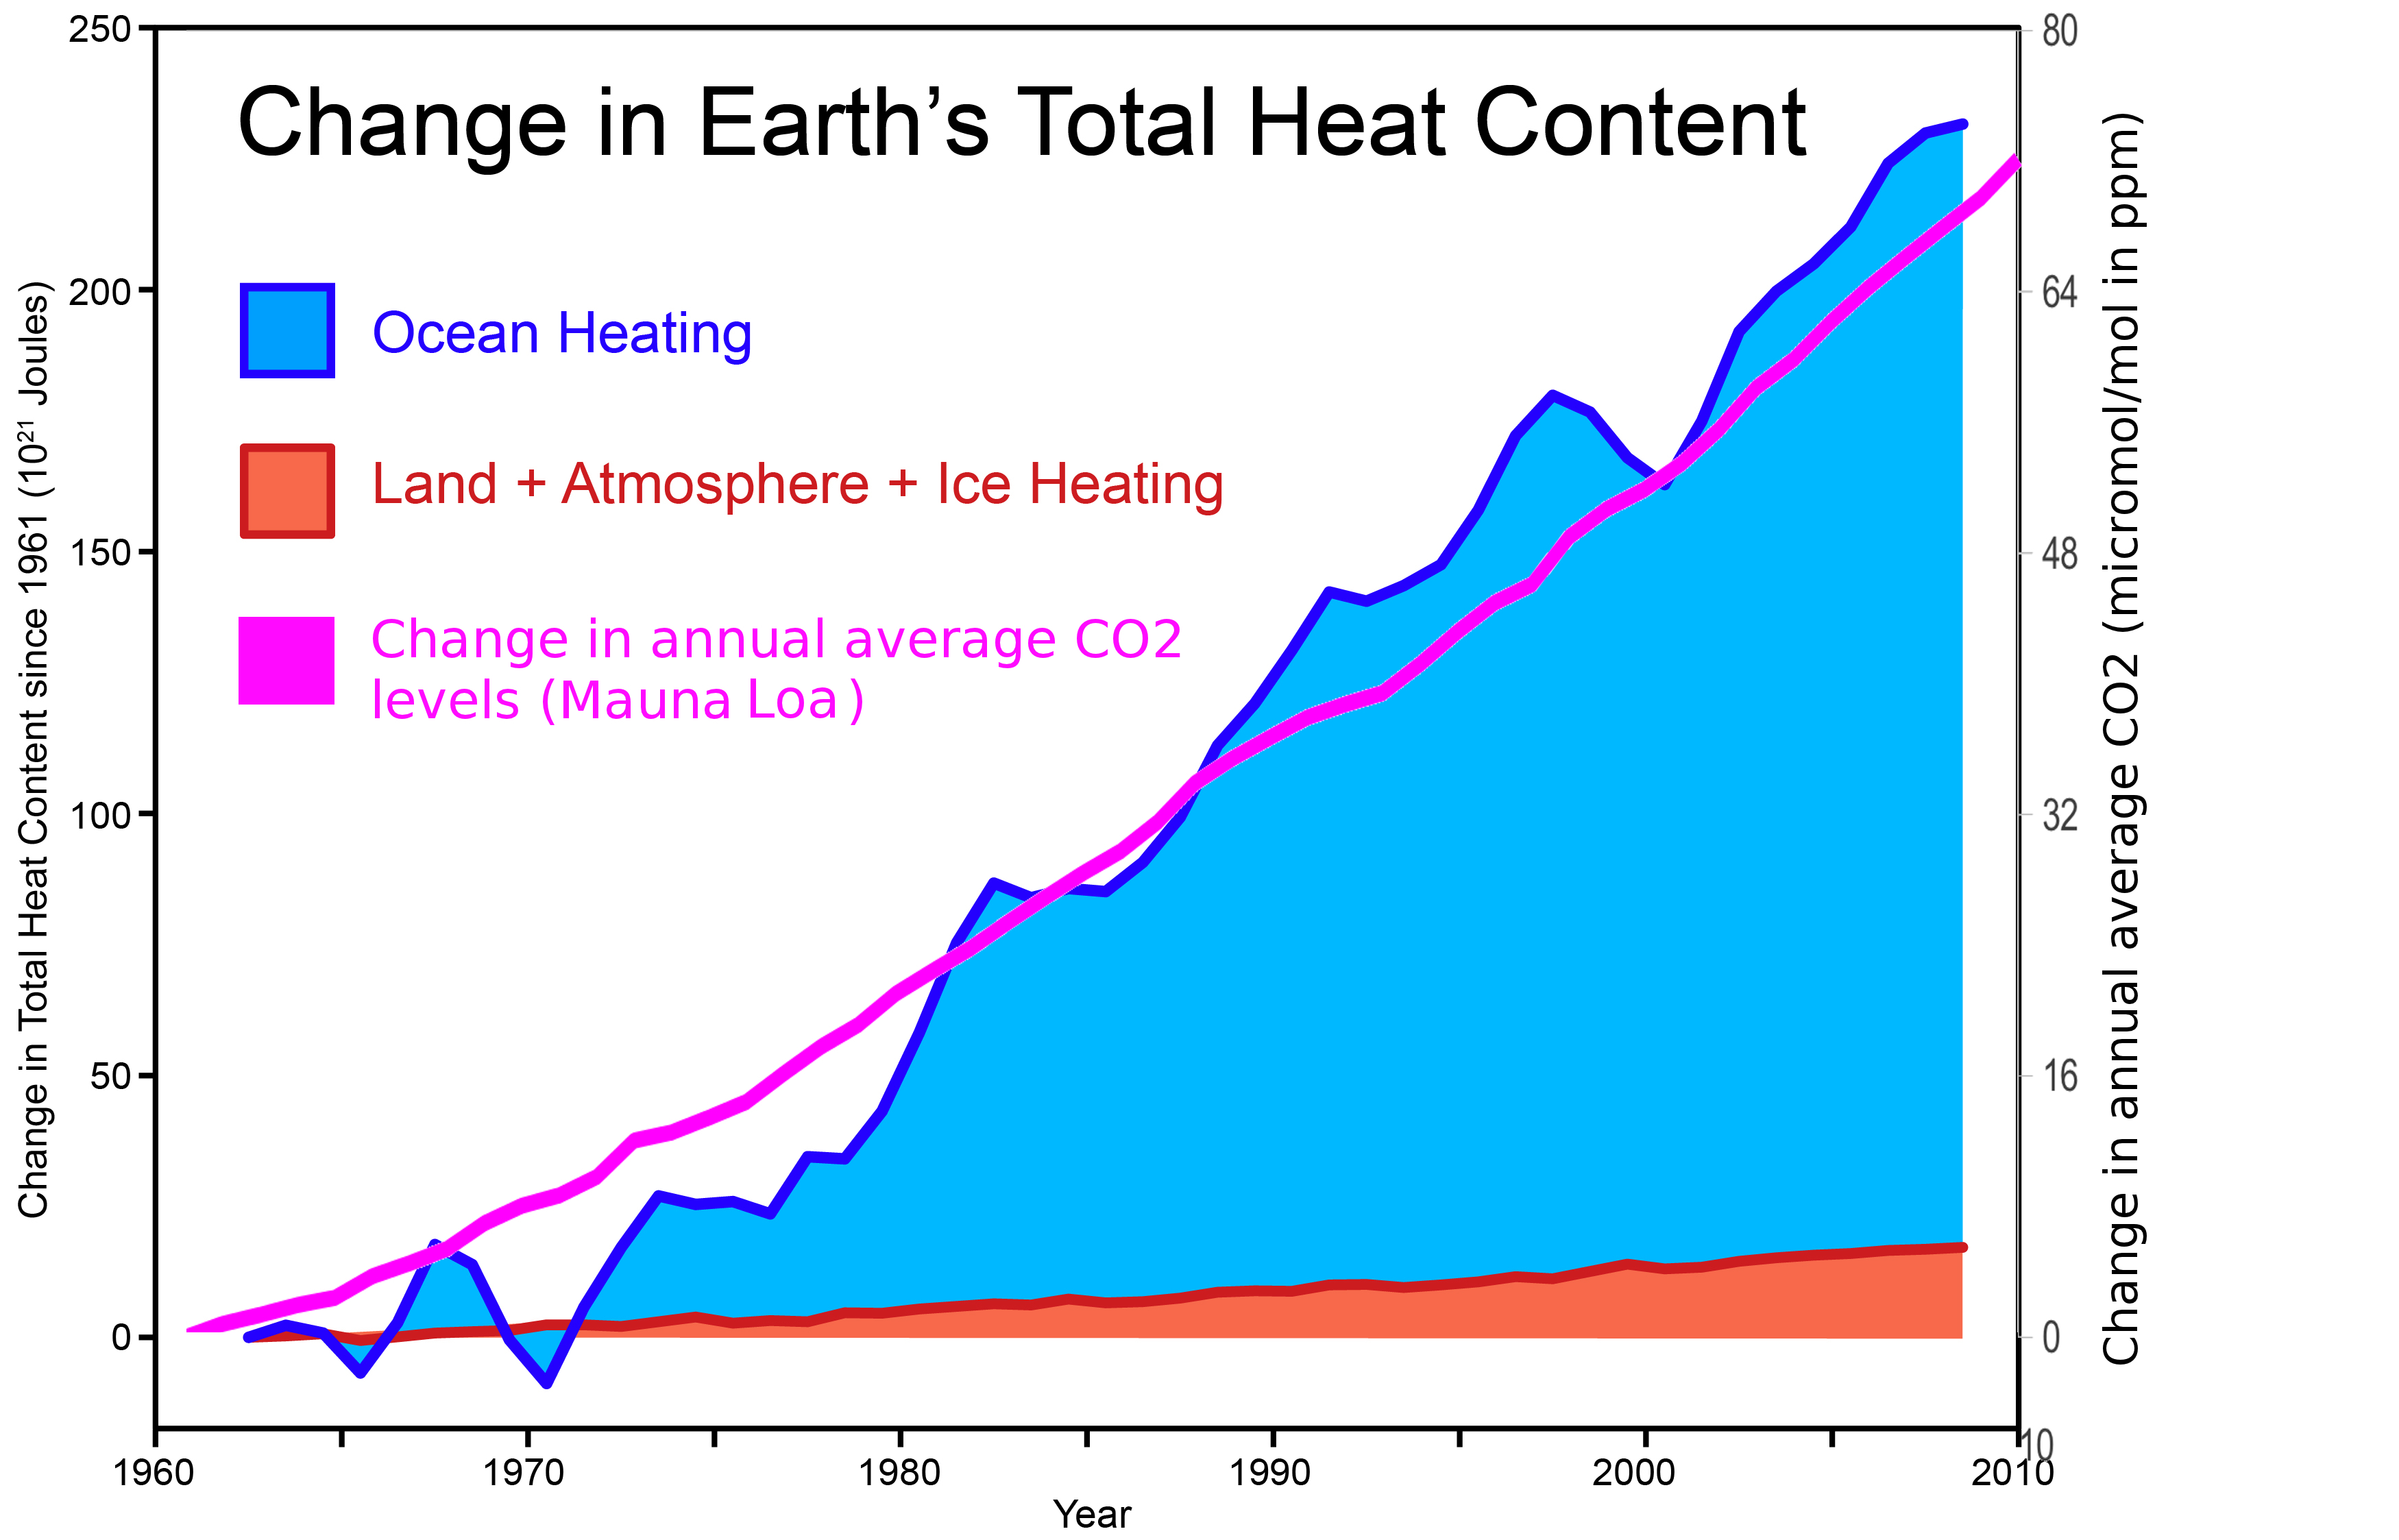
Second, atmospheric CO2 levels have not lagged the current warming – they have led it. This is very clear in all of the data that has been analyzed looking at CO2 levels and global temperature over the past 200 years, since anthropogenic expulsion of CO2 into the atmosphere began to ramp during the American and European industrial revolutions. The story is told in the CO2 data shown in the insets of the figure below.

- IPCC Report 4, Working Group 1, Figure 3.6: Greenhouse Gas Concentrations

The above figure is taken from Ref. [4]. We see that rapid increases in atmospheric CO2 levels (the top plot) began in the 1800s and have continued unabated since. The real up-tick in levels began in 1900, when the slope of the change increased. The next increase in slope was then in about 1955-1960. Let’s then compare that to when temperature changes began over the same period. The figure below, also from [4], shows these relative to the average temperature between 1850-2006:

Whether we look at global average temperature or just the average in the Northern or Southern Hemispheres, we see the same trend. Temperature seemed to be going in regular cycles around a flat average from the start of the graph (1850) until about 1920. Then in 1920, the average around which regular cycles occurred obtained a new slope – no longer zero (flat), but positive (increasing). From about 1920 to 1980, a period of 60 years, the global average temperature increased by 0.2 degrees Celcius. From 1980-2006, a period of 26 years, global average temperature increased by an additional 0.2 degrees Celcius. The time to double the temperature change cut in half between 1920-1980 and 1980-2006. That’s stunning.
But CO2 levels began increasing long before these temperature changes took off. So in the current era of warming, CO2 is driving the change and not the other way around. CO2 now leads temperature.
Is that CO2 really from human activity?
A final statement that ACCDs might make about all of this is the following: so what . . . there’s no proof that this CO2 comes from human activity, so maybe this is just a natural cycle where CO2 happens to lead temperature for a change.
Actually, there is a clear physics answer to this question: isotope ratios. I have commented on this before [5] based on studies like those in reference [6]. CO2 that remains in the atmosphere for a very long time, or which is present in biological material on the surface of the earth, is constantly exposed to cosmic ray radiation. This radiation can generate the isotope of stable carbon-12, unstable carbon-14, in a ratio that is actually easily measurable to high precision. In other words, CO2 that derives from close to the surface of the earth has a larger C-14 content ratio than carbon that is more shielded from cosmic ray radiation.
Carbon that has been underground for a long time, in the form of fossil fuels, is just such a kind of carbon that will have a lower C-14 level. By studying the level of C-14 in the air trapped in tree rings and other sources, we can watch to see if over time the atmosphere loses C-14 as more C-12-rich fossil-fuel carbon is pumped into the air. Sure enough, this is exactly what is seen. C-14 is a fingerprint, and we observe that since the 1800s the level of C-14 has decreased dramatically in the atmosphere. This tells us that less radiogenic carbon is entering the atmosphere – just the kind of carbon obtained from deep sequestered fossil fuel. The only species burning lots of deep-sequestered carbon is humans, and thus the modern CO2 levels are anthropogenic in origin.
Conclusions
So, does CO2 lag temperature? Yes, it can, and historically it has. The ice core record is clear on that. However, in the modern warming cycle CO2 and other gases have led the warming trend. In addition, that CO2 is rich in C-12 but depleted in C-14 because it comes from reserves deep in the earth. Anthropogenic warming is the status quo, and acting otherwise is wishing your doctor hadn’t diagnosed you with cancer and shopping around for a doctor that will say otherwise.
Appendix
4/17/2011: Based on a reader comment, I produced an annotated version of the Vostok Ice Core data plot. The blue lines help you to see how significant warming trends match to locations on the insolation curve. I made the plot “blind”: I zoomed way in on the temperature curve, marked the start of significant warming trends with blue lines, and when I drew all lines I zoomed out and extended the lines to the axes. That way I wouldn’t only choose warming trends that definitely correlated with high radiation from the sun. The blue lines show that this appears to be the case, but any bias I possess should not be a factor in that relationship.

References
[1] J. R. Petit, J. Jouzel, D. Raynaud, N. I. Barkov, J.-M. Barnola, I. Basile, M. Bender, J. Chappellaz, M. Davis, G. Delaygue, M. Delmotte, V. M. Kotlyakov, M. Legrand, V, Y Lipenkov, C. Lorius, L. Pepin, C. Ritz, E, Saltzman, and M. Stievenard, “Climate and history of the past 420,000 years from the Vostok ice core, Antarctica,” Nature 399 (1999) 429-436
[2] http://en.wikipedia.org/wiki/Insolation
[3] http://en.wikipedia.org/wiki/Milankovitch_cycles
[4] “Contribution of Working Group I to the Fourth Assessment Report of the Intergovernmental Panel on Climate Change, 2007,” Solomon, S., D. Qin, M. Manning, Z. Chen, M. Marquis, K.B. Averyt, M. Tignor and H.L. Miller (eds.) http://www.ipcc.ch/publications_and_data/ar4/wg1/en/contents.html
[5] “Seen and Unseen” http://steve.cooleysekula.net/blog/2010/05/25/seen-and-unseen/
[6] http://adsabs.harvard.edu/abs/1981E&PSL..53..349S [“Atmospheric C changes resulting from fossil fuel CO2 release and cosmic ray flux variability.” Stuiver, M. and Quay, P. D. Earth and Planetary Science Letters, vol. 53, no. 3, May 1981, p. 349-362. ]


6 thoughts on “Popcorn Science: Lazy CO2?”
This is great, Steve. I was looking for some explanation since a couple of weeks ago a friend of mine who does research in climate change and is an ACCDoubter pointed out the fact that CO2 had been lagging in the ice core record. They say that the earth is coming out of the mini ice age so warming is part of the natural cycle and man-made CO2 increase may not have anything to do with it. And the last 10 years the warming is not significant (I am not sure about this data). You mention that warming trends were always initiated on the increasing side of insolation, but it’s not easy to see that from the graph. There seem to be some regions (eg. ~330kyr ago) where insolation and temperature are out of phase. If there is a graph that overlay the two curves that will be much clearer. If the statement is true, it will very hard to explain the current warming trend as part of the natural cycle.
Another reason my friend has doubt is that the climate simulation models are too complex and have many parameters that can be tweaked. Very often, he says, there are too much tweaking going on and it’s hard for him to believe the validity. I guess they don’t do blind analyses; that’s the problem.
I couldn’t find a good graph that showed the insolation/temperature correlation. It’s possible the IPCC report contains something like that, but I didn’t find it. I agree that this plot is hard to read by eye. In a few minutes, I am going to add a graph to this blog post with blue lines annotating where warming trends tend to initiate. I added these lines “blind” to the insolation curve. I zoomed way in, added a blue line to the start of a significant warming trend, and then when I was done I zoomed out and extended the lines to the axes. It looks like warming trends do correlate well with periods of high or increasing solar radiation.
Using climate models to argue against “believing in climate change” is a bit of a red herring; models aren’t used to obtain historic CO2 trends or temperature trends, especially since modern data collection and record-keeping entered this business in the 1800s. Climate models are about projecting the outcome of warming; that does have a lot of uncertainty. But you can’t argue against ACC using that kind of logic because the data are clear: warming is happening, and that CO2 led the warming trend, and that CO2 comes from deep sequestered sources. Period.
As for recent temperatures, I have a post with some graphs (one in particular from NASA) that you might find useful. They are in this older post: http://steve.cooleysekula.net/blog/2010/02/22/thy-will-be-done/
Thanks for the data and analysis. That’s very helpful.
I guess the problem of model uncertainty is that when general public sees many seemingly different predictions, they tend to think these scientists don’t really know what they are doing. Especially you seem to get more air time if you are more provocative. When the overly exaggerated effects are scaled back by more solid studies, people again think there are something wrong. We as scientists of course know that science progress will always have bumps and mistakes during the process, and that doesn’t invalidate the final conclusion as long as the data and analysis are sound. Unfortunately climate science has too much at stake, and there are too many forces trying to influence it (not to mention conspiracy theories). It’s very hard to fight against.
The best we can hope for is to be “honest brokers” of information for climate science policy. Anything less casts aspersions on scientists as whole. If the public, or public policy makers, choose to do nothing (regardless of their claimed reason), then it’s incumbent upon us as scientists to continue to advocate and try to live our lives in a manner consistent with how we expect others to live. At the very least, we’ll get a big “nah nah nah nah, told you so” out of this . . . !
Good solid empirical evidence statements.
Four articles to show anthropogenic CO2 emissions are so small and pose zero effect using empirical data and show human activity (CO2 emissions) is not causing any problems.
http://www.climatechangedispatch.com/home/9016-the-global-warmingclimate-change-paradox-why-co2-has-not-is-not-nor-will-not-be-an-issue.
http://www.climatechangedispatch.com/home/9044-climate-change-paradox-creating-a-nonevent-crisis
http://www.climatechangedispatch.com/home/9105-climate-change-paradox-current-co2-levels-are-not-of-anthropogenic-origins
http://www.climatechangedispatch.com/home/9130-global-warmingclimate-change-paradox-closing-the-book-on-an-illusion
They are NOT copyright, and dozens of sites are posting these articles. Money is not the motivation to publish these articles??? Seems to be the case here – not published for the money.
My observation (I agree, alot can be learned from being a fly on the wall) is that the Climate Change promoters are having hissy fits because of these publications. All their arguments and presentations are irrelivant now.
Jef
Hi Jeff,
Thanks for your comment. The links your posted in your comment illustrate beautifully several examples of why it’s important for bloggers to do their homework before writing a post:
(1) all of the posts are by the same individual, who writes an immense amount of statements with no reference to actual scientific research. This is a classic sign of a person pushing pseudoscience.
(2) where there are citations, they are most often to articles from other sites, few of which are actually journalistic sites. Those cannot be considered primary sources, and it’s primary sources that a well-thought-out and well-researched blog post should strive to find. A reader needs to be given the original work so that they can go to it and see the data collection methodology, analysis techniques, and statistical interpretations of the data.
(3) one of the citations points to http://petitionproject.org/, which itself links to a paper produced by authors in that organization. The current temperature, glacier, and solar data referenced by that paper is more than a decade old. We’ve learned a lot more about solar forcing and its quite small role on recent climate change. Most of the modern research that clarifies the decade-old debate about solar forcing appeared in the more recent IPCC summaries on current understanding of such contributions (c.f. http://www.ipcc.ch/publications_and_data/ar4/wg1/en/tssts-2-4.html).
So, in fact, the articles you provided actually contain little empirical evidence, since there is no way of following up on the claims of the author though reference to their primary sources. The author instead chooses to write for pages without reference to the underlying observations that support their claims.
Regarding accessibility of articles, I happen to agree that more scientific journals should make their articles more widely available for free. I happen to like very much the model of PLoS, where the article authors must pay a substantial fee to publish their work and the journal then makes the article freely available. We need better models for journals so that they can remain solvent, provide the kind of solid scientific review the research community expects and deserves, and still provide the research and interpretations to a broad audience. That said, most of these articles are available from the library at your local university. To make it easier for your to visit your local university and look up the article, I expanded reference [6] in my post to the full name of the article and the journal information. That will make it easier to find.
Don’t let the author of those blog posts trick you; a classic pseudoscience trick is to say lots of plausible things but never cite a single peer-reviewed published article. Please continue to seek out writers who take the time to look at their own citations and think about the content of those results. Thanks for visiting my blog!