
In the first two parts of the “Hypothesis of Big Government” series, I got my hands on federal employment and employee income data, and also on median family income data, from about 1947 to 2007. A commenter on the second part of the series noted that
” . . . an intelligent conservative might post this question: ‘Even if I accept the idea that income is a good measure of quality of life, what matters is how much income I spend (after taxes), not how much I earn. Bigger government usually leads to more taxes and less disposable income. Are your income numbers gross or disposable?'”
This is an excellent point – disposable (post-tax) income is a MUCH better measure of quality of life than gross income. The median family income quoted was gross (at least, the Census Bureau does not indicate otherwise). I decided to hunt around for median pre- and post-tax income to see what I could learn.
I was only able to find this data for 1980-2003 [1]. Since there are already interesting trends in those two decades (large growth of govt. size and continued growth of deficit in the 1980s, followed by rapid shrinking govt. size and deficit in the 90s, followed by slight growth in size and large growth in deficit in the 2000s), this period could already be informative. In addition, it has the benefit of political party flipping – three terms of Republican presidents in the 80s, two terms of a Democrat in the 90s, and most of one term of a Republican president in the 2000s (up through 2003, when the data ends).
One important note: the data available is median HOUSEHOLD, not family, income. These are not the same. I will therefore show median pre-tax family income as well as median pre-tax household income. The family income is a control; if household income tracks family income, we should see this and then consider the post-tax household income as a reliable measure of post-tax family income.
Observations
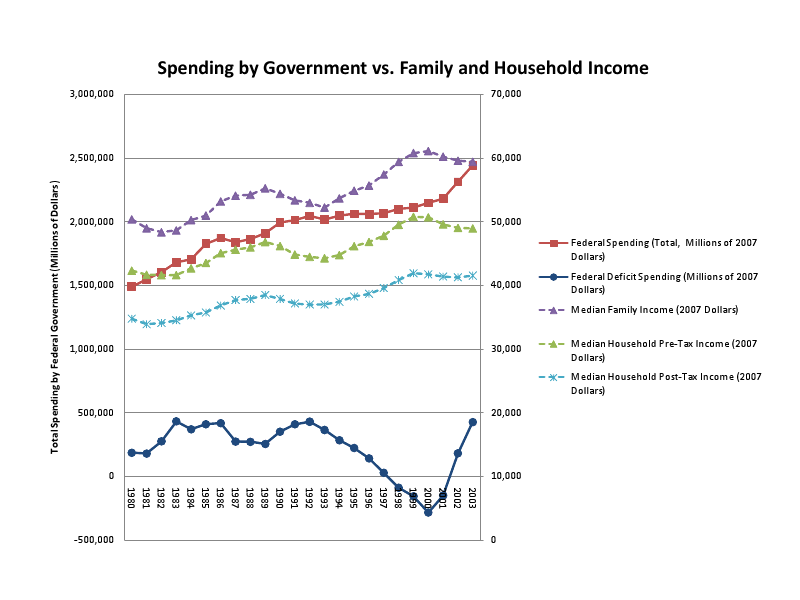
First, let us compare the control (pre-tax family income) to the new data (pre-tax household income). They track beautifully. The slope of the ratio of these two data sets is 0.002 (2007 Dollars)/year, which is essentially zero. Therefore, pre-tax household income measures the same trends as pre-tax family income.
The pre- and post-tax household incomes are clearly different, and that difference varies with time. The difference, divided by the gross, is a measure of the median tax burden. From 1980-1992, this (as a percentage of gross income) was 17.7%; from 1993-2000, this was 17.1%; from 2001-2003, this was 15.9%. So on average it’s been dropping by about 1% per decade.
The trends in disposable income largely track those in gross income, except after 2000, when disposable income flattens out while gross income drops. The opinion of the author is that here we are seeing the effect of the Bush tax cuts, since government spending was very much on the rise (along with deficit spending) while disposable income seems to hold against those pressures.
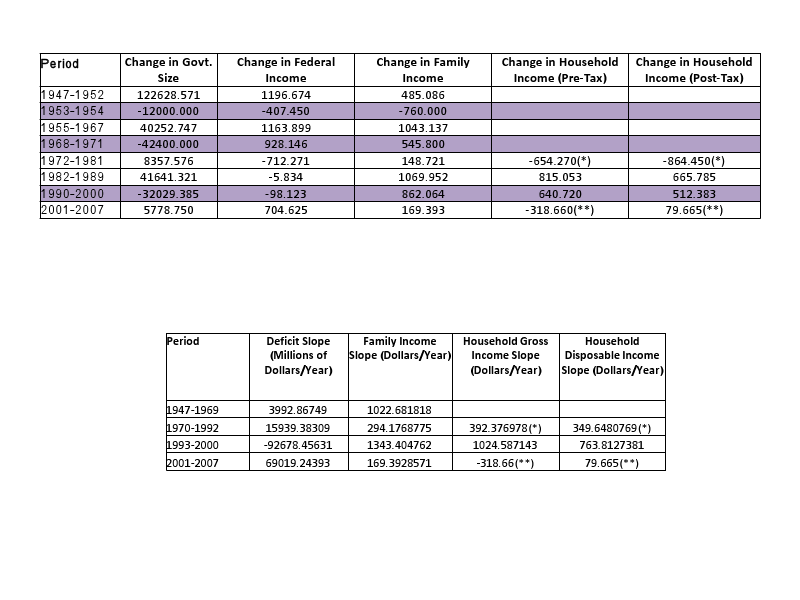
The tables illustrate the slopes in the size of government, government spending/deficits, and household and family income. We see that the trends in household and family incomes largely track, as expected. The caveat is that in the first and last periods studied (where household data is available), there is LESS household data, so one cannot expect the slope measured with fewer points to perfectly track the slope in the family income data. In between, where there is just as much data in both samples, we can make more reliable observations.
Considering the relationship between the size of government and disposable income, the conclusion is that the pace of increase in disposable income is largely unaffected by the large changes in the size of government from 1980-2000. Disposable income grows, but by less, after 2000 (until 2003, when the data ends) There are definitely internal variations that seem largely to coincide with recessions, but overall the trend is up and doesn’t seem all that connected to swings in the size of government.
The relationship between federal deficits and disposable income seems to be inverted, as it was with gross income. When deficits grow at a large rate, the rate of increase in disposable income is slowed. This is most apparent in the 2000s, but also clearly visible in the 1980s.
Conclusions
Disposable income is a more realistic measure of the quality of life in an American household. Trends in disposable income largely track those of gross income, except in the early 2000s. The author attributes this to the effect of the Bush tax cuts, but that is an opinion. In general, when federal deficit spending increases, the pace of disposable income growth decreases.
[1] SOURCE: U.S. Census Bureau, Current Population Survey, Annual Social and Economic Supplements
http://www.census.gov/hhes/www/income/histinc/rdi1.html

