
There is one more study that is of interest in testing the hypothesis that big government is bad for America. While there appears to be no negative effect of the physical size of government on incomes [1], there is the potential that government spending has a negative impact on incomes. To study this, I obtained U.S. Federal spending numbers from [2]. I then plotted family income, total federal spending (in 2007 millions of dollars), and federal deficit spending (in 2007 millions of dollars). The trends here were MUCH more interesting, and do speak to the trade-off between government outlays and family income.
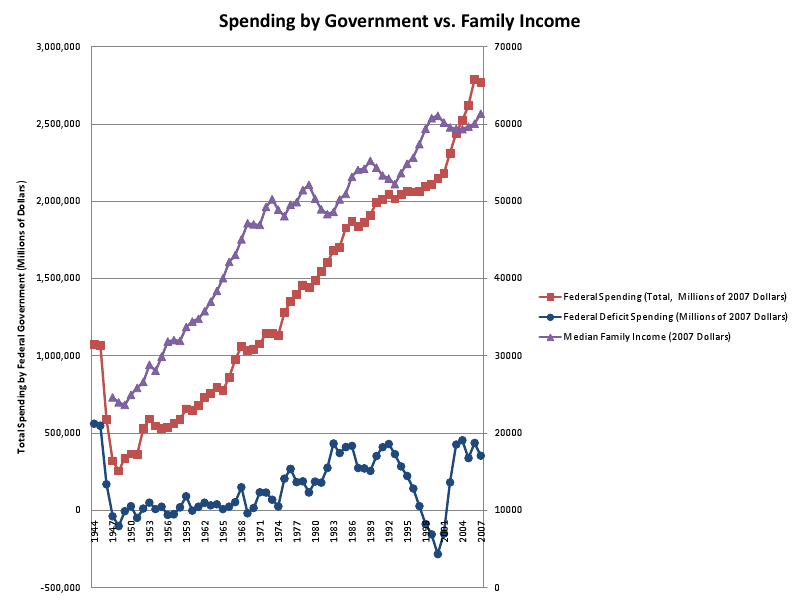
The data are shown here:
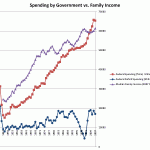
Quantitative Analysis of Trends
Let us first consider TOTAL government spending. In both family incomes and total government spending, the trends are overall positive (although slopes do change at times). There is a long period from about 1950-1992 where the slope of total govt. spending is nearly unchanged, while family incomes experience large growth, then slower growth after 1969. Later, when the government spending slope lessens in 1992-2001, family incomes trend upward with an improved slope. When total federal spending increases sharply again 2001, family incomes do waver here. For the period after 2001, the trend in federal spending is due to war spending, while the trend in stagnating incomes is connected to the recession that started around that time and worsened later when housing speculation collapsed.
If one computes the correlation coefficient for family income and total government spending, the value returned is 0.94. That is, they both strongly trend positive over the period from 1947-2007.
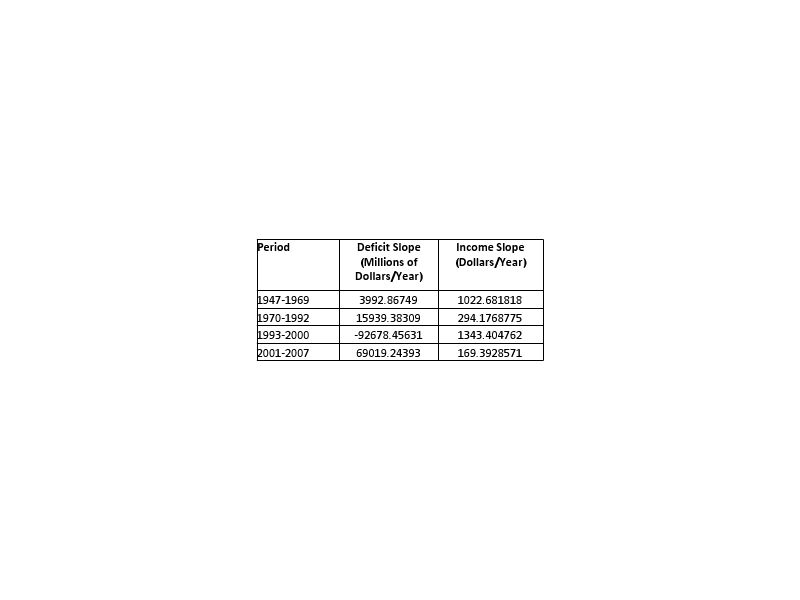
Government deficit spending is much more complicated. Let us break the problem into four periods, where the slopes in government deficit spending appear constant (though different in each period): 1947-1969, 1970-1992, 1993-2000, and 2001-2007. The table in the image above shows what the slopes in deficit spending (in millions of 2007 dollars per year) and family income (in 2007 dollars per year) look like during these periods. The trend is clear: when deficits trend strongly upward, incomes don’t trend upward as quickly. During periods when deficits are more flat or trend downward, incomes do trend upward MORE strongly. Clearly, there is a correlation (not necessarily causation) between the two, and while numerically it is positive it is far less than one – 0.48. It’s between a strong correlation and no correlation, due to the fact that while incomes trend positive overall they do so more strongly when deficits are flat or trending downward.
Conclusions
There is no overall negative correlation between incomes and total government spending. For whatever reason (my own speculation is GDP), they both trend strongly upward over time. However, periods of strong deficit spending correlate highly with periods of more slowly increasing income. Whatever the common cause (this study cannot pinpoint causation), there are clearly inverse impacts on deficits and income.
[1] http://steve.cooleysekula.net/blog/2010/03/13/the-hypothesis-of-big-government/


2 thoughts on “The Hypothesis of “Big Government” – Part 2”
Steve,
First, let me say how impressed I am that you manage to write so prolifically and well for your blog. I have difficulty squeezing out a few paragraphs per month, you post whole papers! How do you do it?
In response to this article, an intelligent conservative might post this question: “Even if I accept the idea that income is a good measure of quality of life, what matters is how much income I spend (after taxes), not how much I earn. Bigger government usually leads to more taxes and less disposable income. Are your income numbers gross or disposable?”
– Luke
Dear Luke,
How do I do it: well, I get an idea stuck in my head and it won’t shut up until I do something about it. It’s an alternative to mowing the lawn. 🙂
Your criticism (or, your hypothetical criticism) is extremely valid. Let me go back to my numbers and, instead, see if I can compare gross and disposable incomes. I believe these were gross incomes, which would NOT in fact reflect the tax burden, but don’t quote me on that. I have to consult the source. I will post a follow-up article in response to this comment.
Regards,
Steve