

I have really thrown myself into physics, since I am stuck at home (a) because there is a pandemic and (b) because SMU won’t let me on campus until tomorrow (because I was abroad when they ended work-related international travel 2 weeks ago). This has been a grand opportunity. Here are some things I learned this week.
UPROOT and UPROOT-METHODS
UPROOT is awesome. It lets me utilize natively in Python files created in ROOT. No more do I need to have ROOT compiled in the background, along with its Python interfaces. I can just import UPROOT and load ROOT files into Python Pandas dataframes, which anyway are how I prefer analyzing data these days.
UPROOT was introduced to me by my former PhD student Matthew Feickert and my current PhD student Chris Milke. I’ve been using it for several weeks to work on a project with one of my undergraduate research students. However, for high-level physics operations, like dealing with four-vector mathematics, ROOT is hard to beat. Turns out, there is a solution.
UPROOT-methods! These are implementations of interfaces akin to C++ classes in ROOT that do cool physics things… like vector arithmetic! I just learned about this today and already did some Lorentz Transformations on particle vectors. I’m pretty happy about this.
MatPlotLib Subplot Gridding!
Sometimes you just want to layout a bunch of graphs in a single plot in a non-uniform way. Consider the following graph:
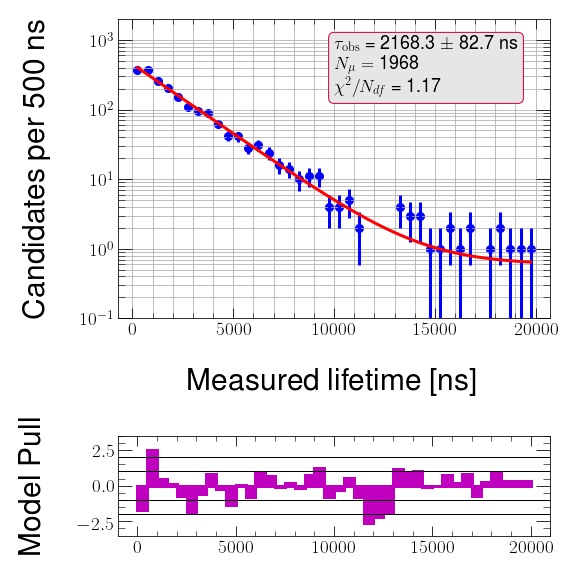
I need to show the fit of an analytic model (an exponential lifetime model) to the data coming from a muon detector in the basement of Fondren Science Building at SMU; below that, I need to show how well the model describes the data after optimizing the model parameterization to reproduce the data. To do this, I need a big plot at the top and a short plot at the bottom. I needed plot grid layouts!
I found this article extremely helpful: https://towardsdatascience.com/subplots-in-matplotlib-a-guide-and-tool-for-planning-your-plots-7d63fa632857?gi=b00175d89216 (it’s how I made that figure above!)
Online Teaching Tips
How do you mute all those jerks with hot mics in Zoom? WHY WON’T MY F**KING MAC LET ME SHARE MY DESKTOP?!?!?!
Check out these tweets.
Planning new experiments and particle colliders is fun
I’ve been participating in a workshop (online only) hosted by Temple University on physics and detector design ideas for the Electron-Ion Collider, a project planned for construction at Brookhaven National Accelerator Laboratory. I’m still just beginning to think about bottom quarks and how to use them to probe structure in protons and nuclei, and the discussions at this workshop have got me thinking about how this problem changes when going from the LHC to a different collider designed to probe such matters with high precision.
What have I learned? I have a lot to learn.