Data is the disinfectant for myth. The Mythbusters routinely use this on their popular TV show, and scientists use it every day. I’ve tried to use a data-based approach in this blog when discussing policy matters, since I believe that data and data analysis has a central role in understanding all aspects of our natural world, from the fundamental structure of the cosmos to the strange ways people behave.
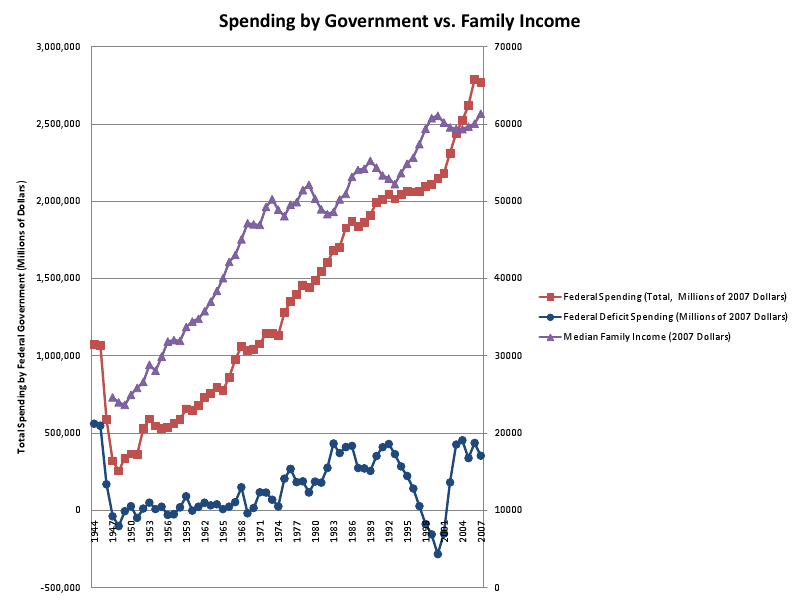
Quite some time ago, I did a personal study of the effect of the size of government on American income [1], and found a few interesting things:
- if anything, the size of government and rise of the average income are positively correlated – this DOES NOT imply causation, only that whatever the underlying cause the two track in a positive, not a negative, way. When income/government grows, government/income also grows.
- since World War II, the size of government has increased most under Republican presidents, dispelling the myth that Republicans are for a small federal government.
I was therefore quite interested in this graphic that a few people I follow on Twitter have been circulating. It originally comes from a data analysis by the New York Times [2], and indicates both the primary holders of U.S. debt and the contributors to that $14.3 trillion in debt:

There is some great data here, and it helps dispel some very popular myths:
- Myth #1: We are primarily indebted to China.
FALSE. About 43% of our debt is held by the U.S. Government itself, while about 25% is held by the public. Only about 8% is held by China, and amount almost equal to the amount held by Japan and LESS then the total amount we owe to a number of other countries. - Myth #2: President Obama is the biggest culprit in this debt crisis.
FALSE. The Republican rhetoric, oft echoed, is that President Obama is responsible for most of our debt problem and that Republicans are the more responsible choice when it comes to solving the debt problem. History and the data disagree STRONGLY on this. Of the $14.3 trillion in debt, about 66% is due to Presidents Ronald Reagan, George H.W. Bush, and George W. Bush; 27% is due to Presidents Bill Clinton and Barack Obama; the rest was accumulated prior to President Ronald Reagan (about 7%).
Now, let’s parse that second myth a bit more deeply. It’s a little unfair to simply take those numbers and assign fractions of the total debt. To get a real sense of the history of this, we should instead answer the following question: per year of a Republican or Democratic Presidency, what is the amount of debt accumulated since the start of Reagan’s Presidency?
If we do that instead, we need to take into account the fact that Reagan was President for 8 years, George H.W. Bush for 4 years, Clinton for 8 years, George W. Bush for 8 years, and Barack Obama for just 3 years. In that case, the per year debt breakdowns are as follows:
- President Ronald Reagan (8 years): $0.238 trillion/year
- President George H. W. Bush (4 years): $0.375 trillion/year
- President Bill Clinton (8 years): $0.175 trillion/year
- President George W. Bush (8 years): $0.763 trillion/year
- President Barack Obama (3 years): $0.800 trillion/year
This reveals a more interesting pattern: between 1980-2000, Presidents were accumulating debt at a rate far below $0.5 trillion per year; since 2000, both a Republican and a Democratic President have accumulated debt at rates close to $0.75 trillion per year, more than doubling previous rates of accumulation. According to the NYT analysis, Bush did so through his huge tax cut program and the fighting of two wars, as well as two economic crises (2001 and 2007); Obama did so through stimulus spending, tax cuts, and the continued economic crisis (the recession ended in 2009) and its implications for automated spending like unemployment compensation.
To get at the original number we were interested in, we can compare the averages of Republican and Democratic Presidents, weighted by the number of years each President was in office (this takes into account that some Presidents and the accompanying Congresses had longer to accumulate debt than others). We find the following term-weighted averages for the two parties:
- Republican President: $0.475 trillion/year (20 total years of Republican Presidents)
- Democratic President: $0.346 trillion/year (11 total years of Democratic Presidents)
So per year of a Republican President, our debt has increased 37% more than under Democratic Presidents.
Projecting into the future
But wait! Obama hasn’t been in the Presidency for a full term. Let’s compute two more numbers: the average of Democratic Presidents assuming that Obama is in office for just 1 term, or for 2 terms. Let’s take the assumption that debt continues to accumulate at $0.8 trillion/year under his administration (this may not be a fair assumption, depending on the outcome of the current debt ceiling talks). Then:
- Republican President: $0.475 trillion/year (20 total years of Republican Presidents)
- Democratic President:
- 1-term Obama: $0.383 trillion/year (12 total years of Democratic Presidents as of 2012)
- 2-term Obama: $0.650 trillion/year (16 total years of Democratic Presidents as of 2016)
One caveat on that last number: if a Republican takes the White House in 2012, they’ll inherit the same crummy financial situation as their predecessor. Recent history has demonstrated that Presidents rarely make significant changes in the direction of raising taxes and/or cutting spending (thus driving down the debt), with the exception of Clinton. That suggests that a Republican President from 2012-2016 will likely accumulate debt at the same rate as an Obama Presidency, which would then drive up the Republican average. So it’s a little unfair to judge Democrats based on a situation that hasn’t yet occurred.
The Wrap
Focusing on the purely historical data, nobody has done more to drive up the national debt than Republican administrations. There are many underlying causes for those, and this analysis in no way provides a normative judgment of the merits or necessity of that spending. Instead, this analysis only aims to take existing data and try to address popular myths about Democrats and Republicans.
The source and holders of debt reveal an interesting pattern. The numbers show that a couple of claims – that China holds most of our debt or that Republicans are better for the debt than Democrats – just don’t hold up when confronted with the facts. Be smart when listening to the current debate; tease out the truth from the spin or the myth. Both parties spend a lot of time trying to hide the basic facts in a great deal of both.
[1] http://steve.cooleysekula.net/blog/2010/03/13/the-hypothesis-of-big-government/ and http://steve.cooleysekula.net/blog/2010/03/13/the-hypothesis-of-big-government-part-2/ and http://steve.cooleysekula.net/blog/2010/03/20/the-hypothesis-of-big-government-disposable-income/
[2] http://www.nytimes.com/interactive/2011/07/28/us/charting-the-american-debt-crisis.html?hp
[3] http://www.flickr.com/photos/moyix/174053226/sizes/l/in/photostream/


